The Birds BI Dynamics 365 Content Packs for Business Central and Finance & Operations, provide out-of-the-box Power BI dashboards.
In all our Power BI implementations, you'll gain access to Microsoft Dynamics ERP and CRM data through these Power BI dashboards and reports within just a few days.
You can then customize these dashboards, or create your own reports to suit your needs using the rich underlying Data model.
In addition to Dynamics 365 data, we can also extract, structure, and model data from other industry specific business software for use in Power BI dashboards.
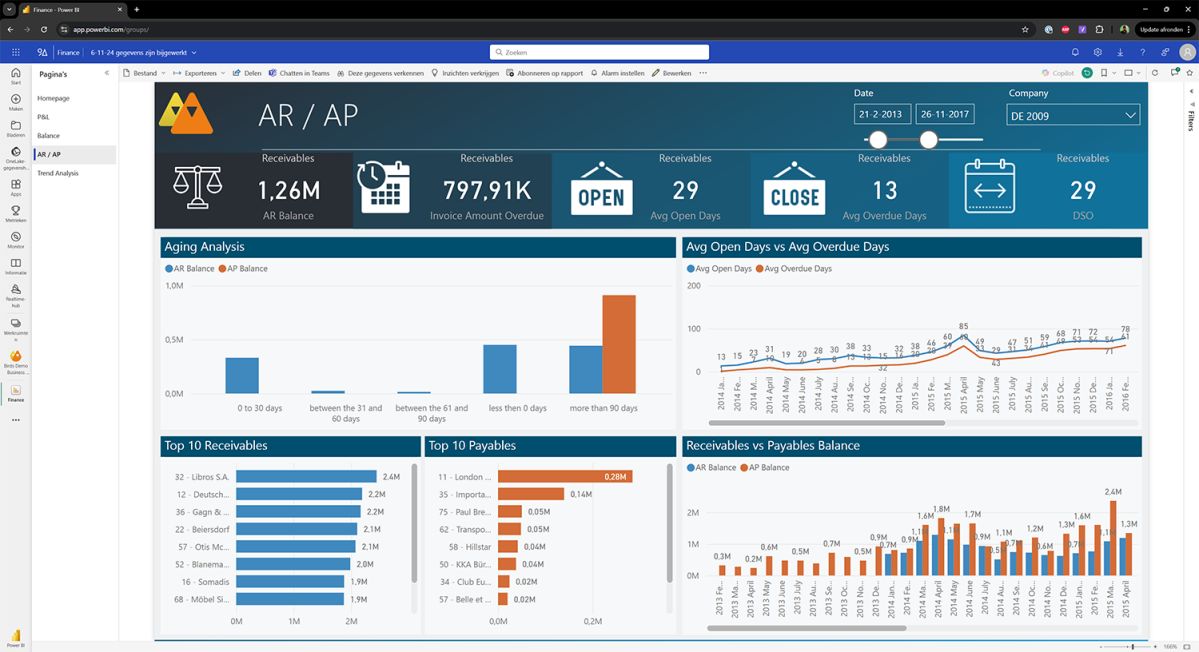
Finance dashboards
Gain deep insights into areas such as profit and loss, budgeting, balance sheets, and accounts receivable/payable. We also offer a dashboard for unmapped accounts.
With various components and drill-down capabilities, you can dive even deeper into the data. The financial dashboards and reports allow you to conduct analyses by company (within the group) and by department.
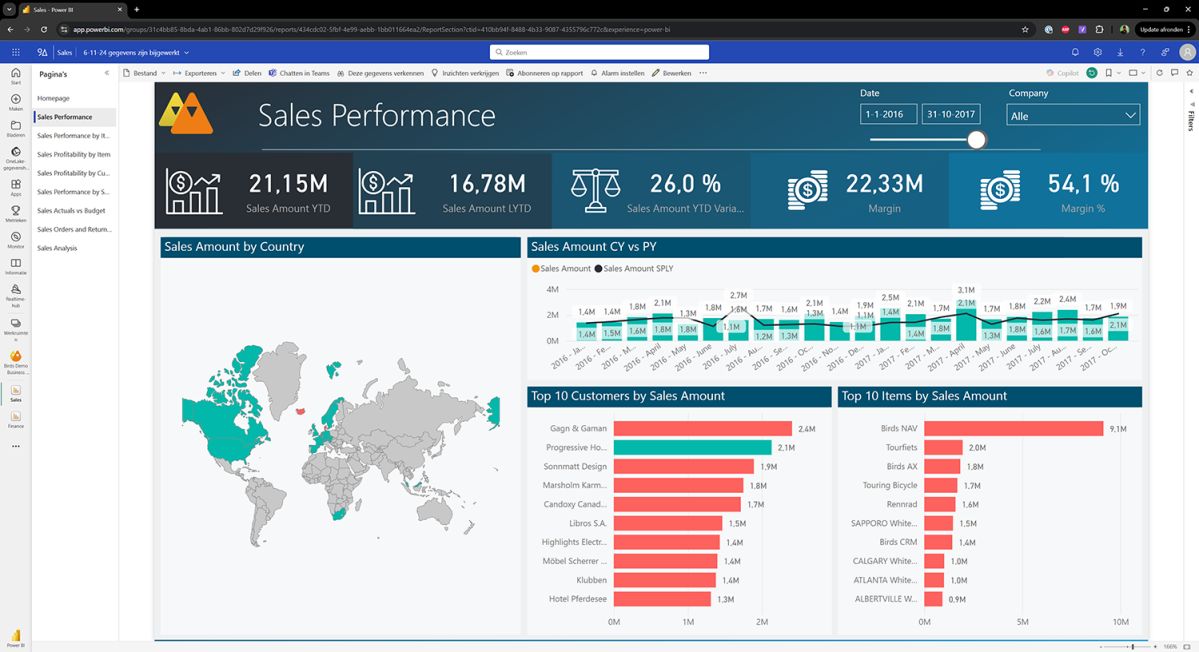
Sales dashboards
Gain deep insights into areas such as sales performance, sales margins, and delivery performance. Review results by customer or by product.
With various components and drill-down capabilities, you can delve even deeper into the data, comparing aspects like product groups and time periods.
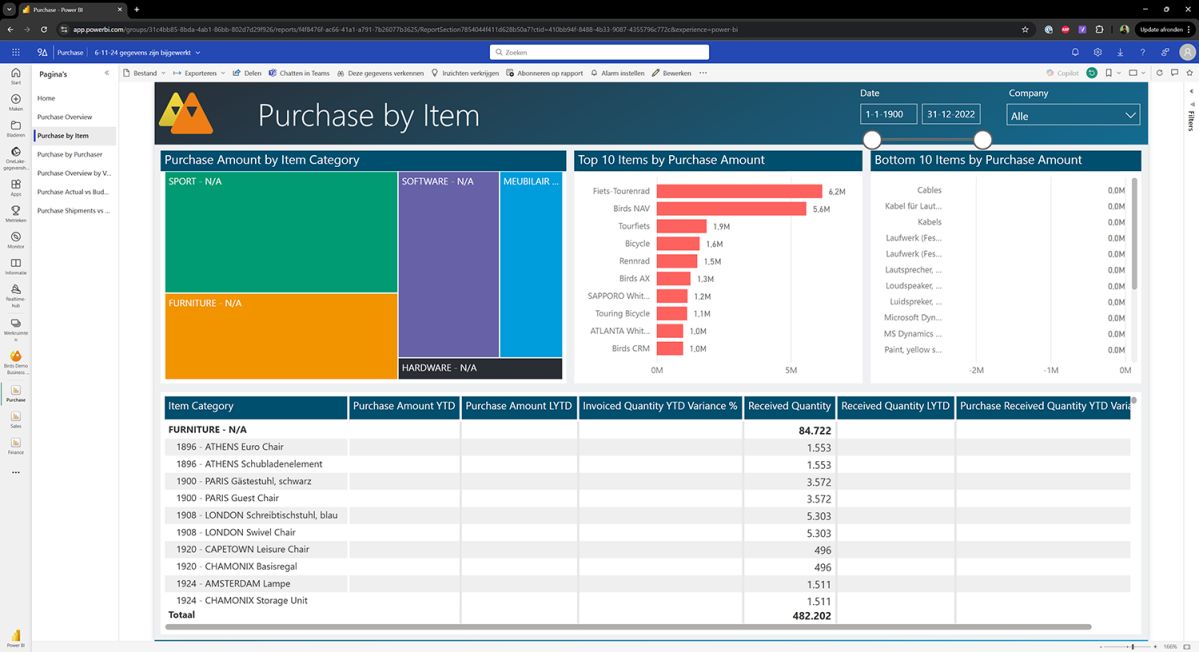
Purchase dashboards
An overview with data from all aspects of procurement, including performance by location or supplier.
Analyze the data by product, buyer, or supplier. Use the various components and drill-down capabilities for even deeper analyses.
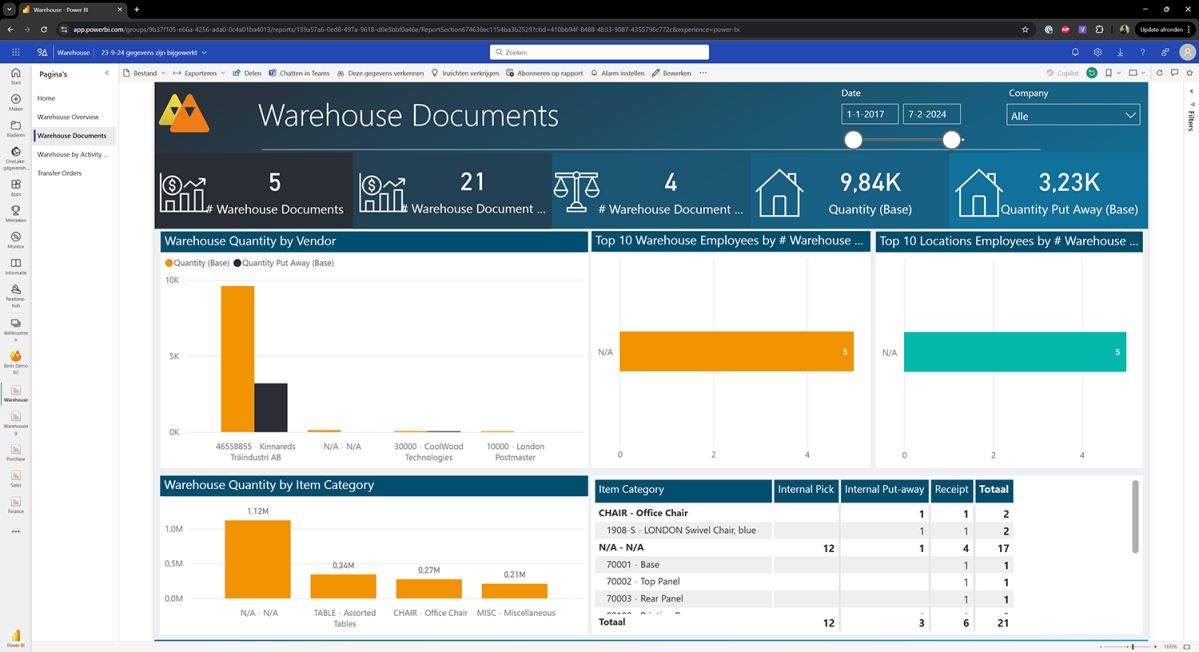
Warehouse dashboards
Gain deep insights into areas such as performance, inventory reliability, quality orders, non-conformities, and warehouse work rules. Review results by warehouse or by company.
With various components and drill-down capabilities, you can delve even deeper into the data, comparing aspects such as pickings and shipments.
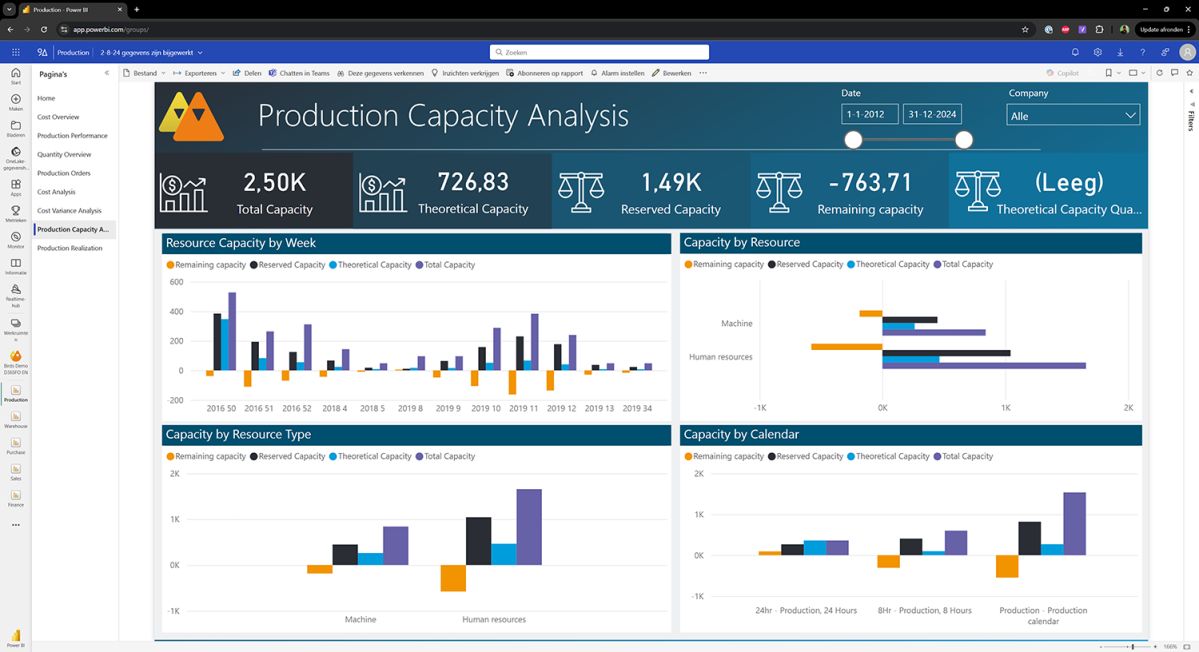
Production dashboards
Gain deep insights into areas such as production performance, costs, orders, and capacity. Review results by product (group) or by company, and manage KPIs such as OTIF and OEE.
With various components and drill-down capabilities, you can dive even deeper into the data and analyze performance in detail.
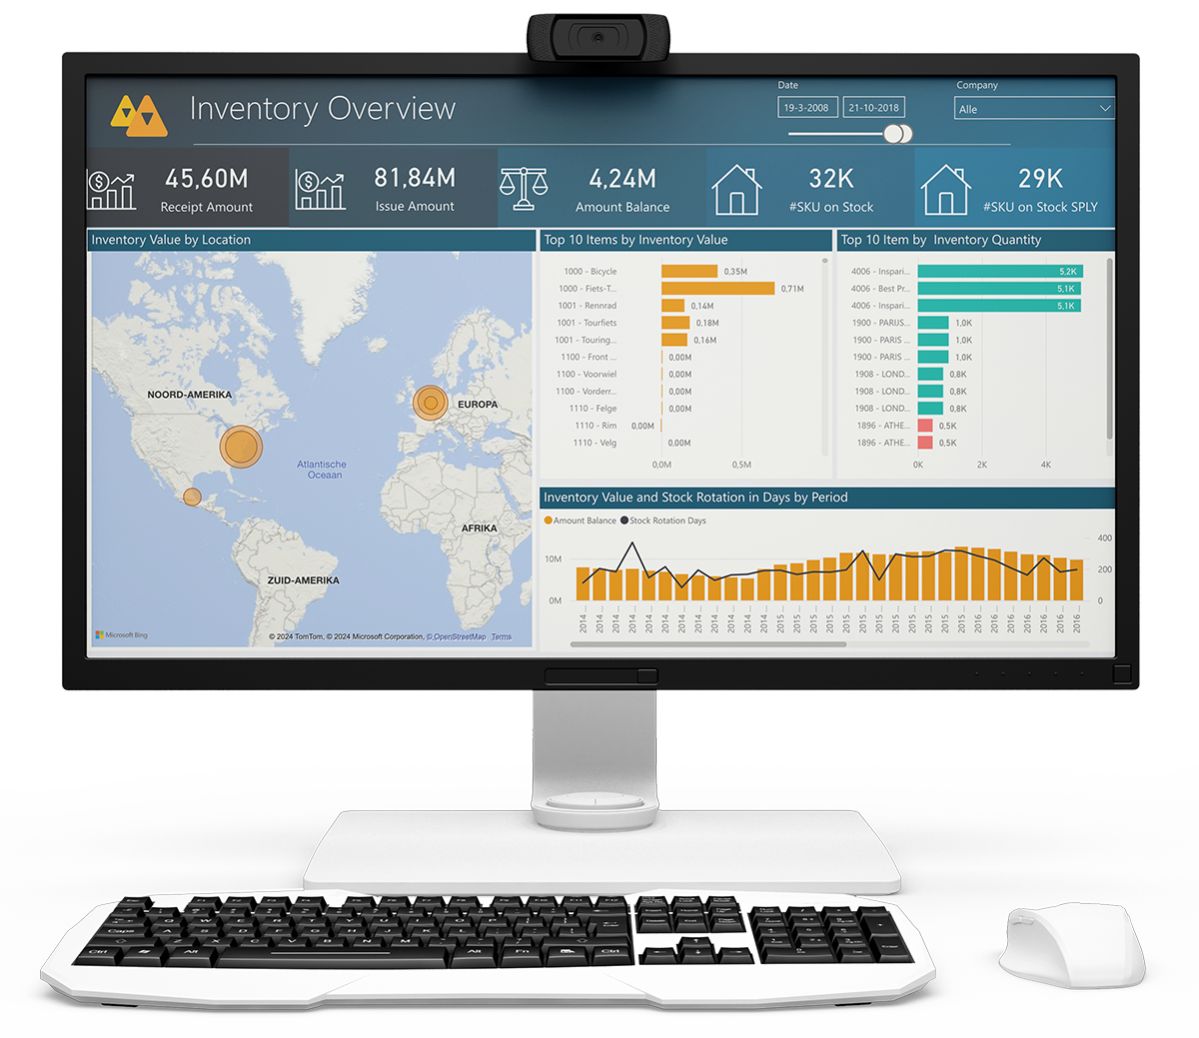
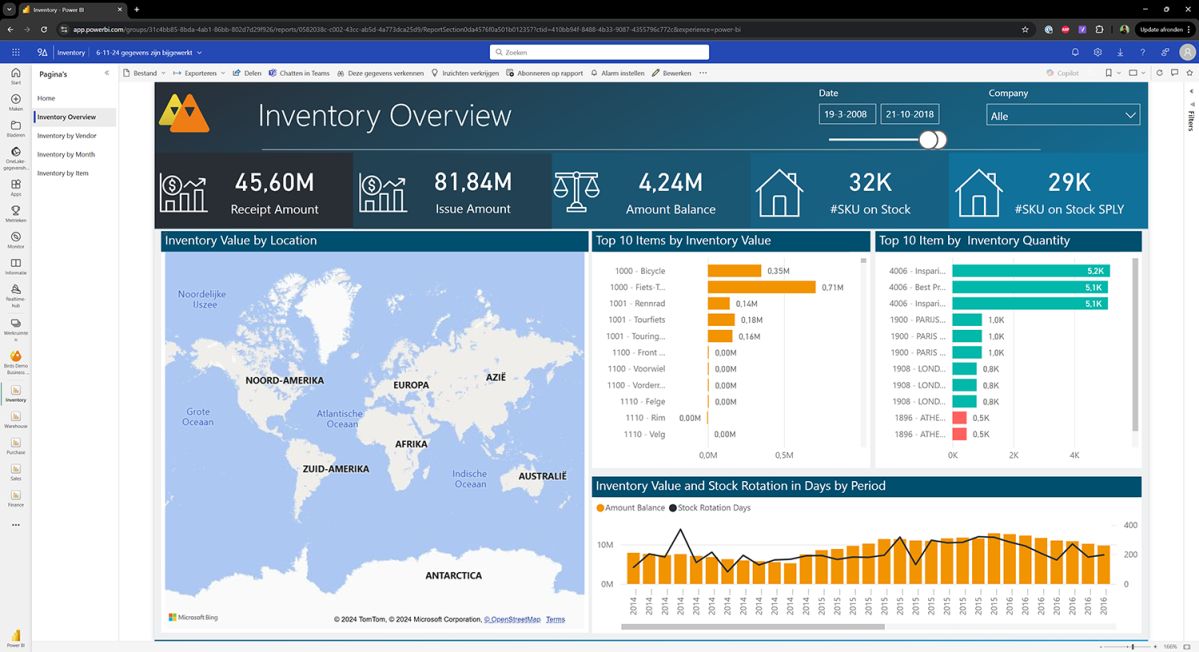
Inventory dashboards
Gain deep insights into all aspects of your inventory and review results by season or by company.
Analyze the data based on products, months, or suppliers. Use the various components and drill-down capabilities for even deeper analyses.
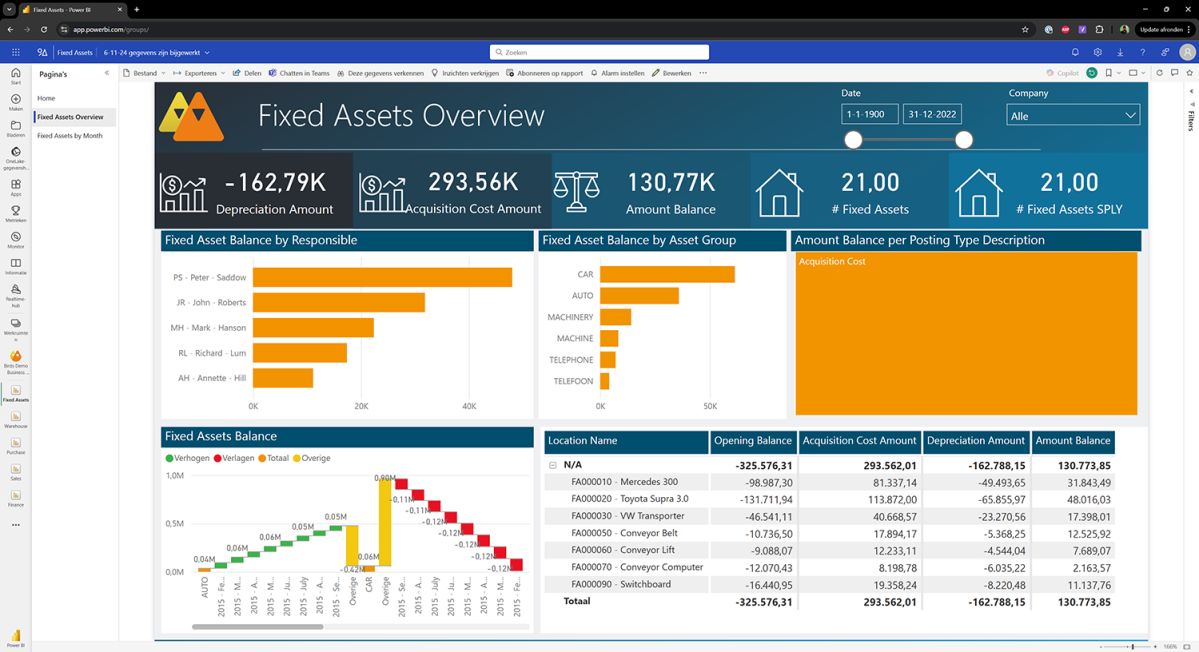
Fixed Assets dashboards
Gain deep insights into areas such as asset movements, depreciation, and amortization. Review results by company or by period.
With various components and drill-down capabilities, you can explore asset overviews and depreciation in greater detail.
4PS Construct dashboards
Gain deep insights into all aspects of construction planning and evaluate project profitability.
Analyze the data based on project, phase, or location. Utilize various components and drill-down capabilities for even deeper analyses.

FAQ
Yes, the Birds BI dashboards and Content Packs work seamlessly in both current Azure and SQL Server environments, as well as within the new Microsoft Fabric framework.
Yes, Birds BI provides a rich data model that allows you to create your own Power BI dashboards. You can customize existing dashboards or build entirely new ones based on your specific needs.
Looking for different Dashboards?
Do you have a Microsoft Dynamics 365 solution and want to extract and combine data from other sources? Our BI consultants can integrate data from nearly any source for use in Power BI.
Curious about the possibilities?