To gain control of your business, data and insights are crucial.
Basing business decisions on crucial KPIs is essential to optimize processes, minimize waste and loss, and enhance profit margins.
With our expertise in the Food & Beverage industry, we have identified five of these KPIs that fundamentally contribute to achieving these goals.
1. Average Margin Variance
A critical KPI for monitoring historical margins is the Average Margin Variance (AMV). This KPI calculates the difference between actual and expected profit margins over a specific period.
By analyzing historical data, the AMV identifies trends and patterns, enabling the detection of deviations.
A positive variance may indicate successful profit optimization, whereas a negative variance alerts to potential inefficiencies.
This KPI provides valuable insights, allowing your organization to proactively respond to changes in margin structures and adjust strategies for a healthy financial performance.
2. Order Fulfillment Time
The Order Fulfillment Time KPI measures the efficiency of delivering orders on time.
This KPI takes into account available inventory and scheduled deliveries, assessing the ability to meet demand.
By monitoring the total time between order placement and delivery, the KPI identifies potential bottlenecks in inventory management and logistics.
A lower Order Fulfillment Time KPI indicates an effective operation, while delays point to potential opportunities for optimization.
This KPI enables your organization to improve logistical processes and ensure customer satisfaction through timely order execution.
3. Delivery Reliability
The various Delivery Reliability KPIs measure the accuracy of order execution and timely deliveries.
On-Time Delivery Rate calculates the percentage of orders delivered within the agreed-upon timeframe.
Incorrect Deliveries tracks the error rate in deliveries, including wrong products or quantities.
Backorder Percentage examines the amount of items not immediately available.
A low error margin and a high delivery rate indicate efficient supply chain management.
These KPIs assist your organization in optimizing logistical processes, improving customer satisfaction, and strengthening overall delivery reliability.
BIRDS Demo webinar
Want to learn how BIRDS can help you gain more insights into your Dynamics data?
Join one of our demo webinars specifically tailored for the Food & Beverage sector.
We will show how BIRDS operates within a Power BI environment and highlight specific reporting capabilities for organizations in the Food & Beverage industry.

4. Shelf Life Performance Index
The Shelf Life Performance Index (SLPI) is a crucial KPI that measures the effectiveness of inventory management and the longevity of products.
This KPI accounts for the extent to which products are sold within their shelf life period.
A high SLPI indicates successful inventory rotation and minimizes waste by preventing expired products.
Furthermore, the Deliverability Score assesses the ability to fulfill orders on time and in full, which is essential for customer satisfaction.
Together, these KPIs provide insight into operational efficiency and adherence to shelf life standards, enabling your organization to ensure sustainable inventory management.
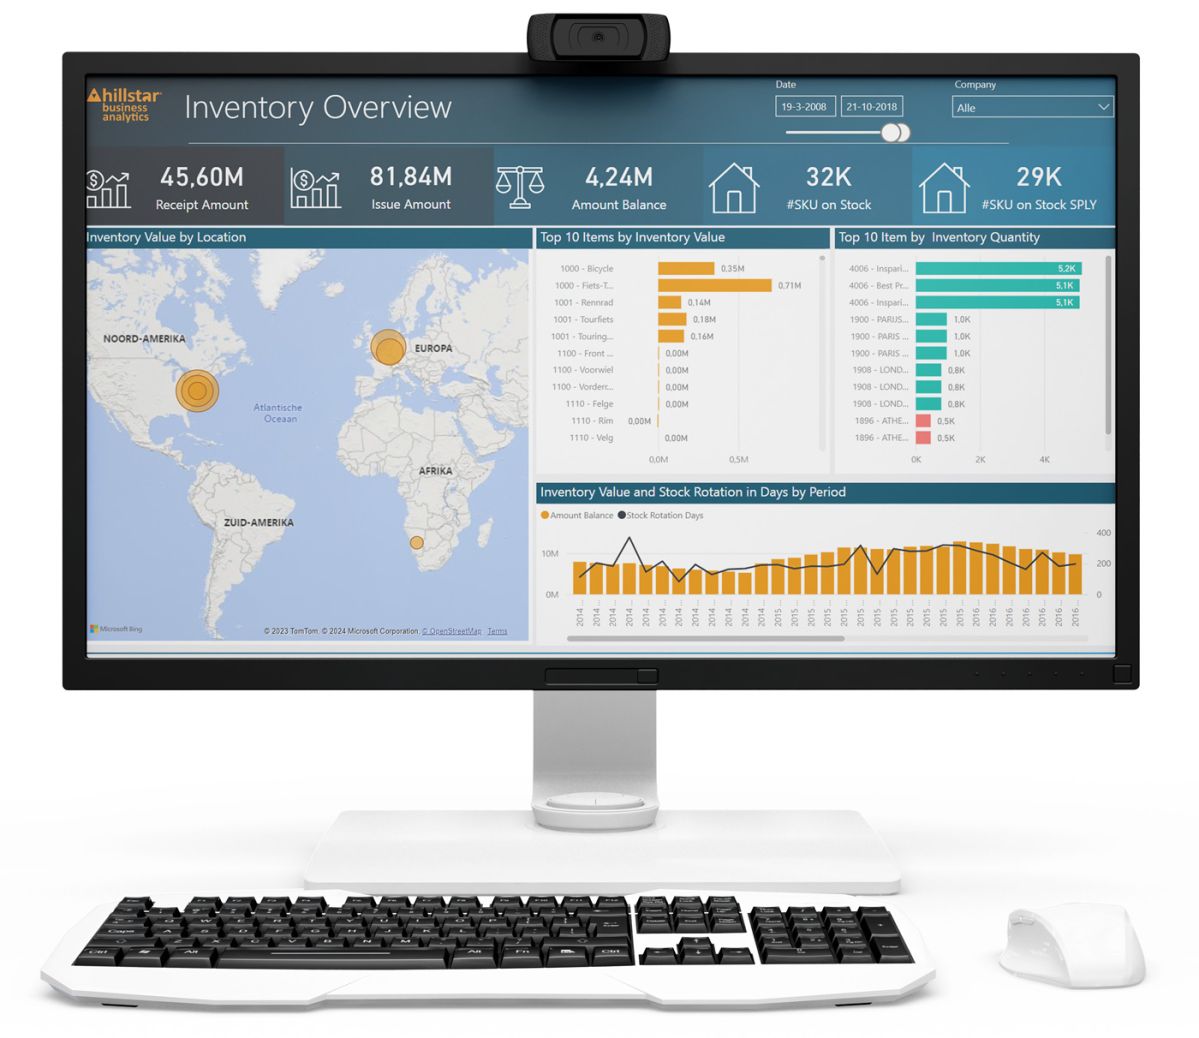
5. Inventory Analysis
Inventory analyses identify products at risk of expiring, enabling companies to proactively reduce obsolete stock.
These analyses also evaluate items with decreasing demand, allowing them to be strategically shifted or phased out.
By assessing trends in demand and inventory levels, the analysis optimizes product assortment and minimizes the risk of obsolescence.
This enables you to prioritize products with shorter shelf lives and adjust inventory flexibly in response to changing market conditions, resulting in more efficient inventory management and a healthier financial standing.

Use these KPIs for immediate adjustments
It goes without saying that in food production or sales, the speed of adjustment can have a significant impact.
Therefore, we advise you to leverage these KPIs for effective steering within your organization.
We understand that this is only possible if you have access to all crucial data from various systems in your reports.
Therefore, prioritize the collection of this data and ensure that the reports are deployed (and actively used) organization-wide as a foundation for informed decision-making.
